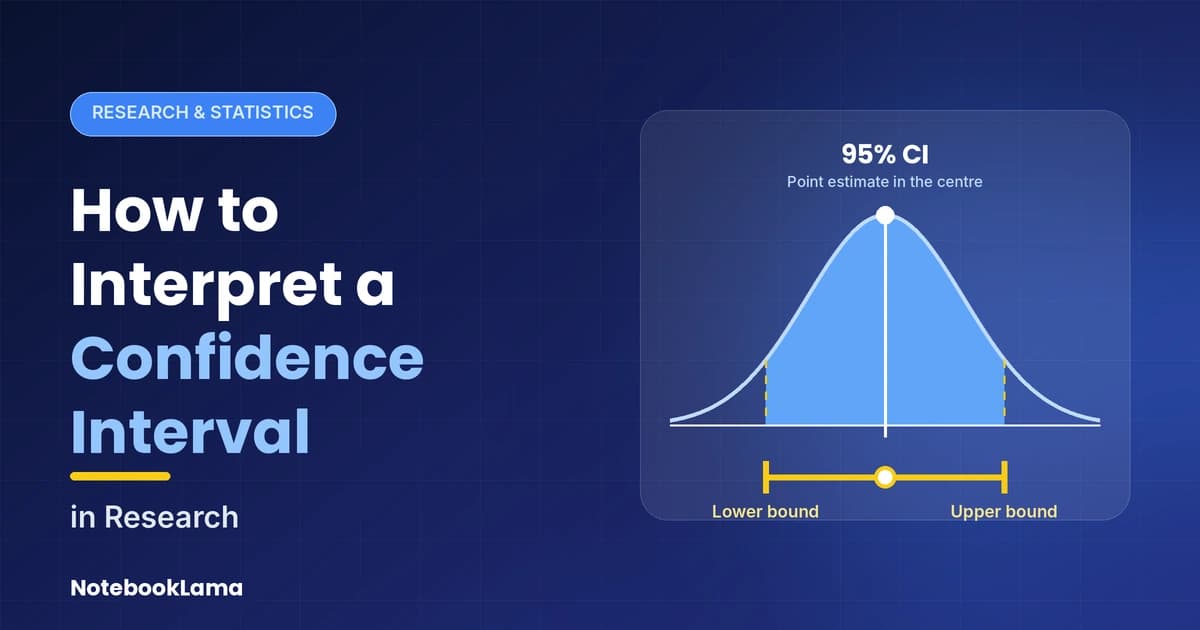
A confidence interval is an interval estimate calculated from sample data to estimate an unknown population parameter, such as a mean or proportion. To interpret one in a research paper, identify the estimate, read both bounds, and ask what conclusions the range supports.
The main distinction is precision: a narrow interval gives a more precise estimate, but it doesn't guarantee an unbiased result. Start with the reported numbers, then connect them to the study's question.
Key takeaways
Read the point estimate and interval together; the estimate alone hides uncertainty.
A 95% confidence level describes the long-run performance of the calculation method, not a probability assigned to the observed interval.
Statistical significance doesn't establish practical importance, causation, or freedom from bias.
Read the estimate, bounds, and confidence level together
Identify the point estimate and interval bounds
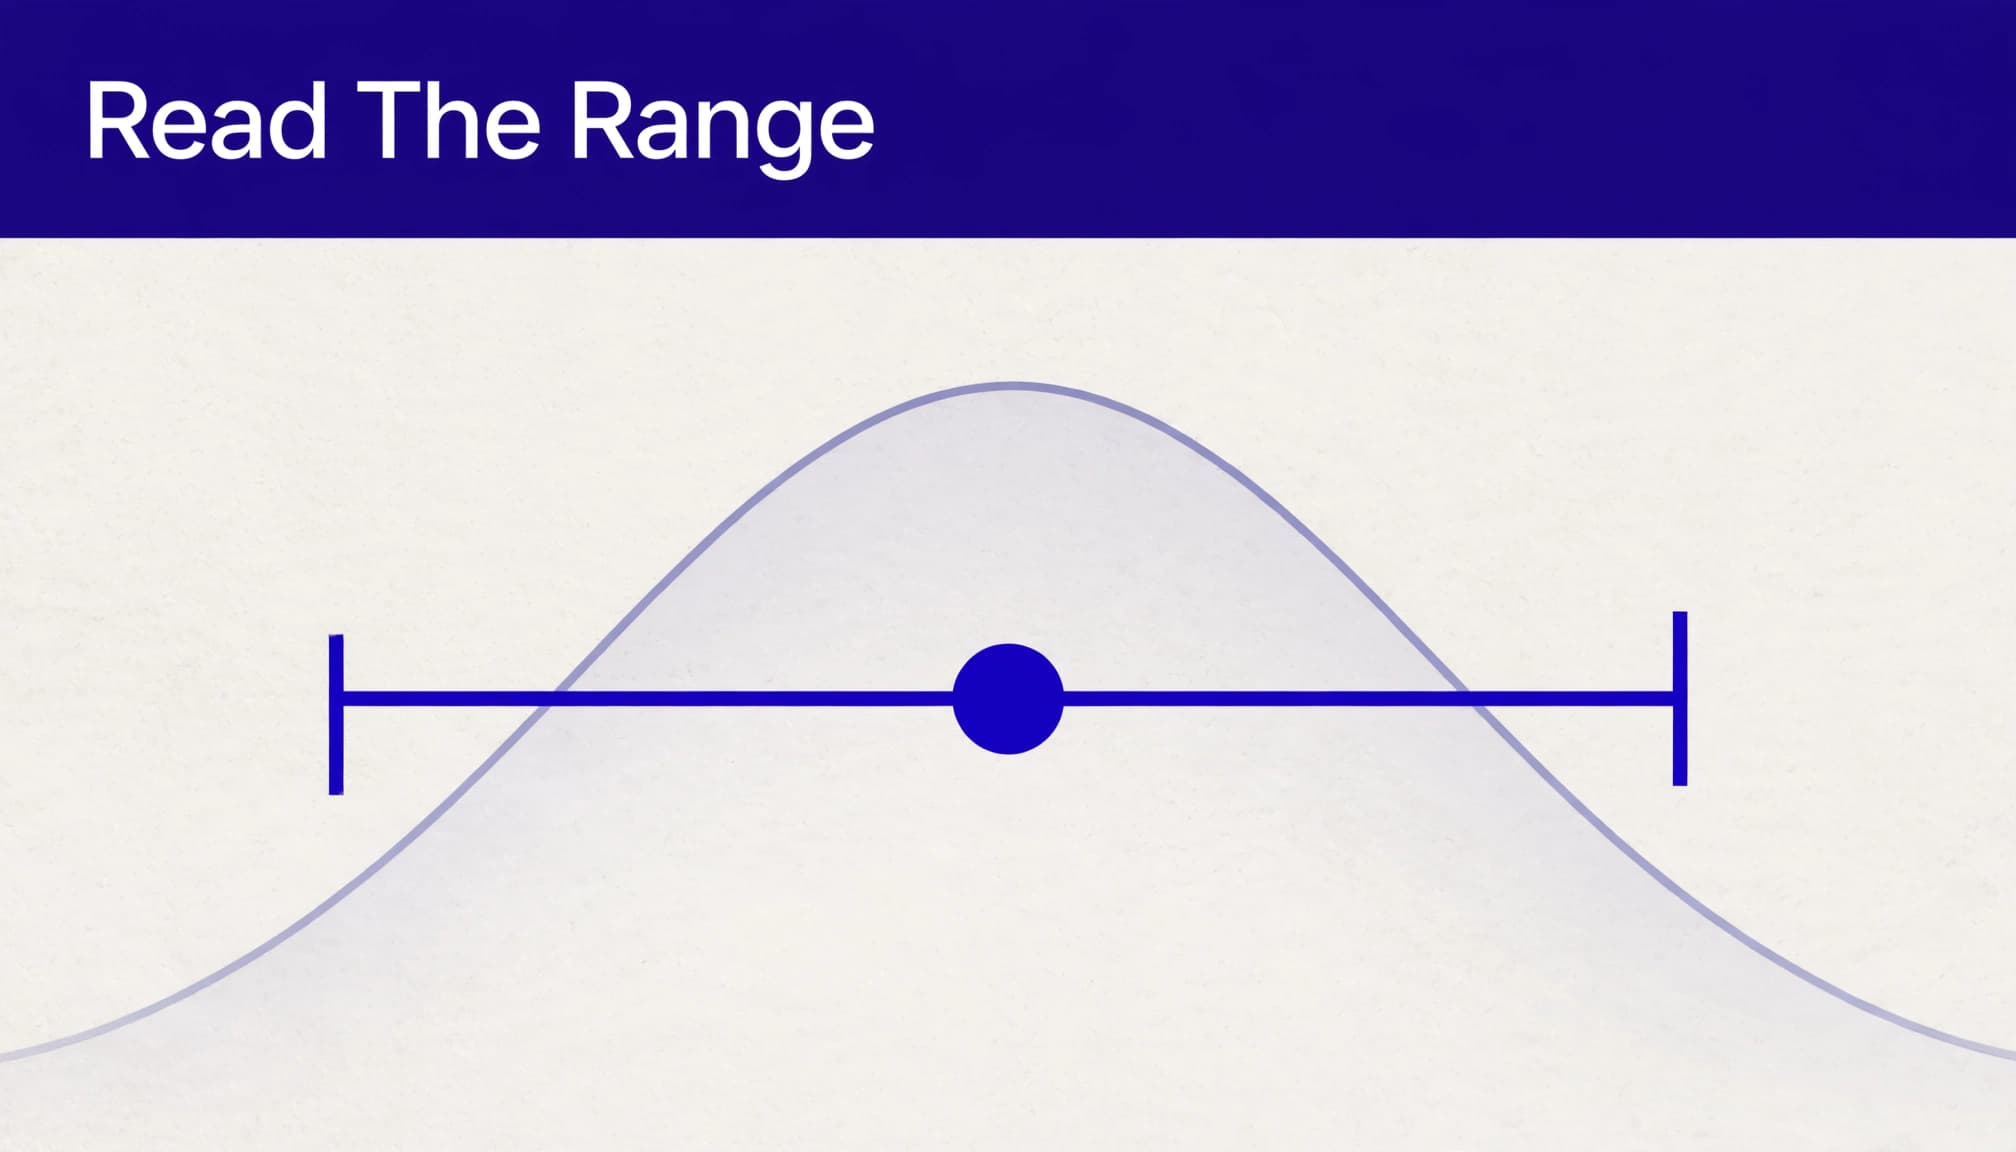
The point estimate is the value calculated directly from the sample, such as its mean. The lower and upper bounds describe uncertainty around that estimate.
For the data set 10, 14, 16, 28, and 20, the sample mean is 17.6. A standard one-sample t calculation gives a 95% confidence interval of approximately 9.11 to 26.09.
Read this as an estimated population mean of 17.6, with values between about 9.11 and 26.09 compatible with the data under the calculation's assumptions. The interval qualifies the estimate; it doesn't describe the spread of individual observations.
Understand what "95% confidence" means
The frequentist interpretation of confidence intervals concerns repeated sampling. If researchers repeated the sampling process many times, about 95% of intervals calculated this way would contain the true population value.
For any particular interval, the true value is either inside or outside it. Therefore, "there's a 95% probability that the true mean lies inside this interval" isn't the standard frequentist interpretation.
That coverage also depends on appropriate sampling, modeling, and calculation assumptions.
Connect the interval to the study question
Establish what the estimate measures
Before interpreting the bounds, identify the outcome, units, population, and follow-up period. An interval for an average answers a different question than one around a treatment difference.
In inferential statistics, a population proportion is the share of a population with a characteristic, while a sample proportion is the share observed in the sample.
Check whether an association is crude or adjusted. Adjusted models account for specified covariates, so their estimates can differ. Our guide to research variables and measures helps keep these details organized.
Judge precision through interval width
In sample-based estimation, precision depends on sample size and variability. Other things equal, larger samples produce narrower intervals.
Because standard error decreases with the square root of sample size, quadrupling the sample roughly halves the margin of error.
However, width must be judged against the research question. An interval spanning negligible and substantial effects leaves an important decision unresolved. A narrow interval can still be misleading if selection bias or measurement error shifts the estimate.
Understand the formula and critical values
Many confidence intervals follow this structure:
Confidence interval = point estimate ± critical value × standard error
For a population mean with known population standard deviation:
CI = x̄ ± z × σ / √n
Here, x̄ is the sample mean, σ is the population standard deviation, and n is the sample size. The standard error, σ / √n, describes how much sample means vary across repeated samples.
The z multiplier comes from the z distribution, which models standardized values under a normal distribution.
The margin of error is the critical value multiplied by the standard error. It's the amount added to and subtracted from the estimate.
These multipliers apply to central, two-sided normal intervals.
Confidence level | z critical value |
|---|---|
90% | 1.645 |
95% | 1.960 |
99% | 2.576 |
For the same data, a 90% confidence interval is narrower than a 95% interval because it uses a smaller multiplier.
When the population standard deviation is unknown, the usual one-sample mean interval uses the sample standard deviation, s, and a t critical value. BMJ's explanation of t tests connects this method with confidence intervals. The distinction matters most with small samples.
Calculate a confidence interval in six steps
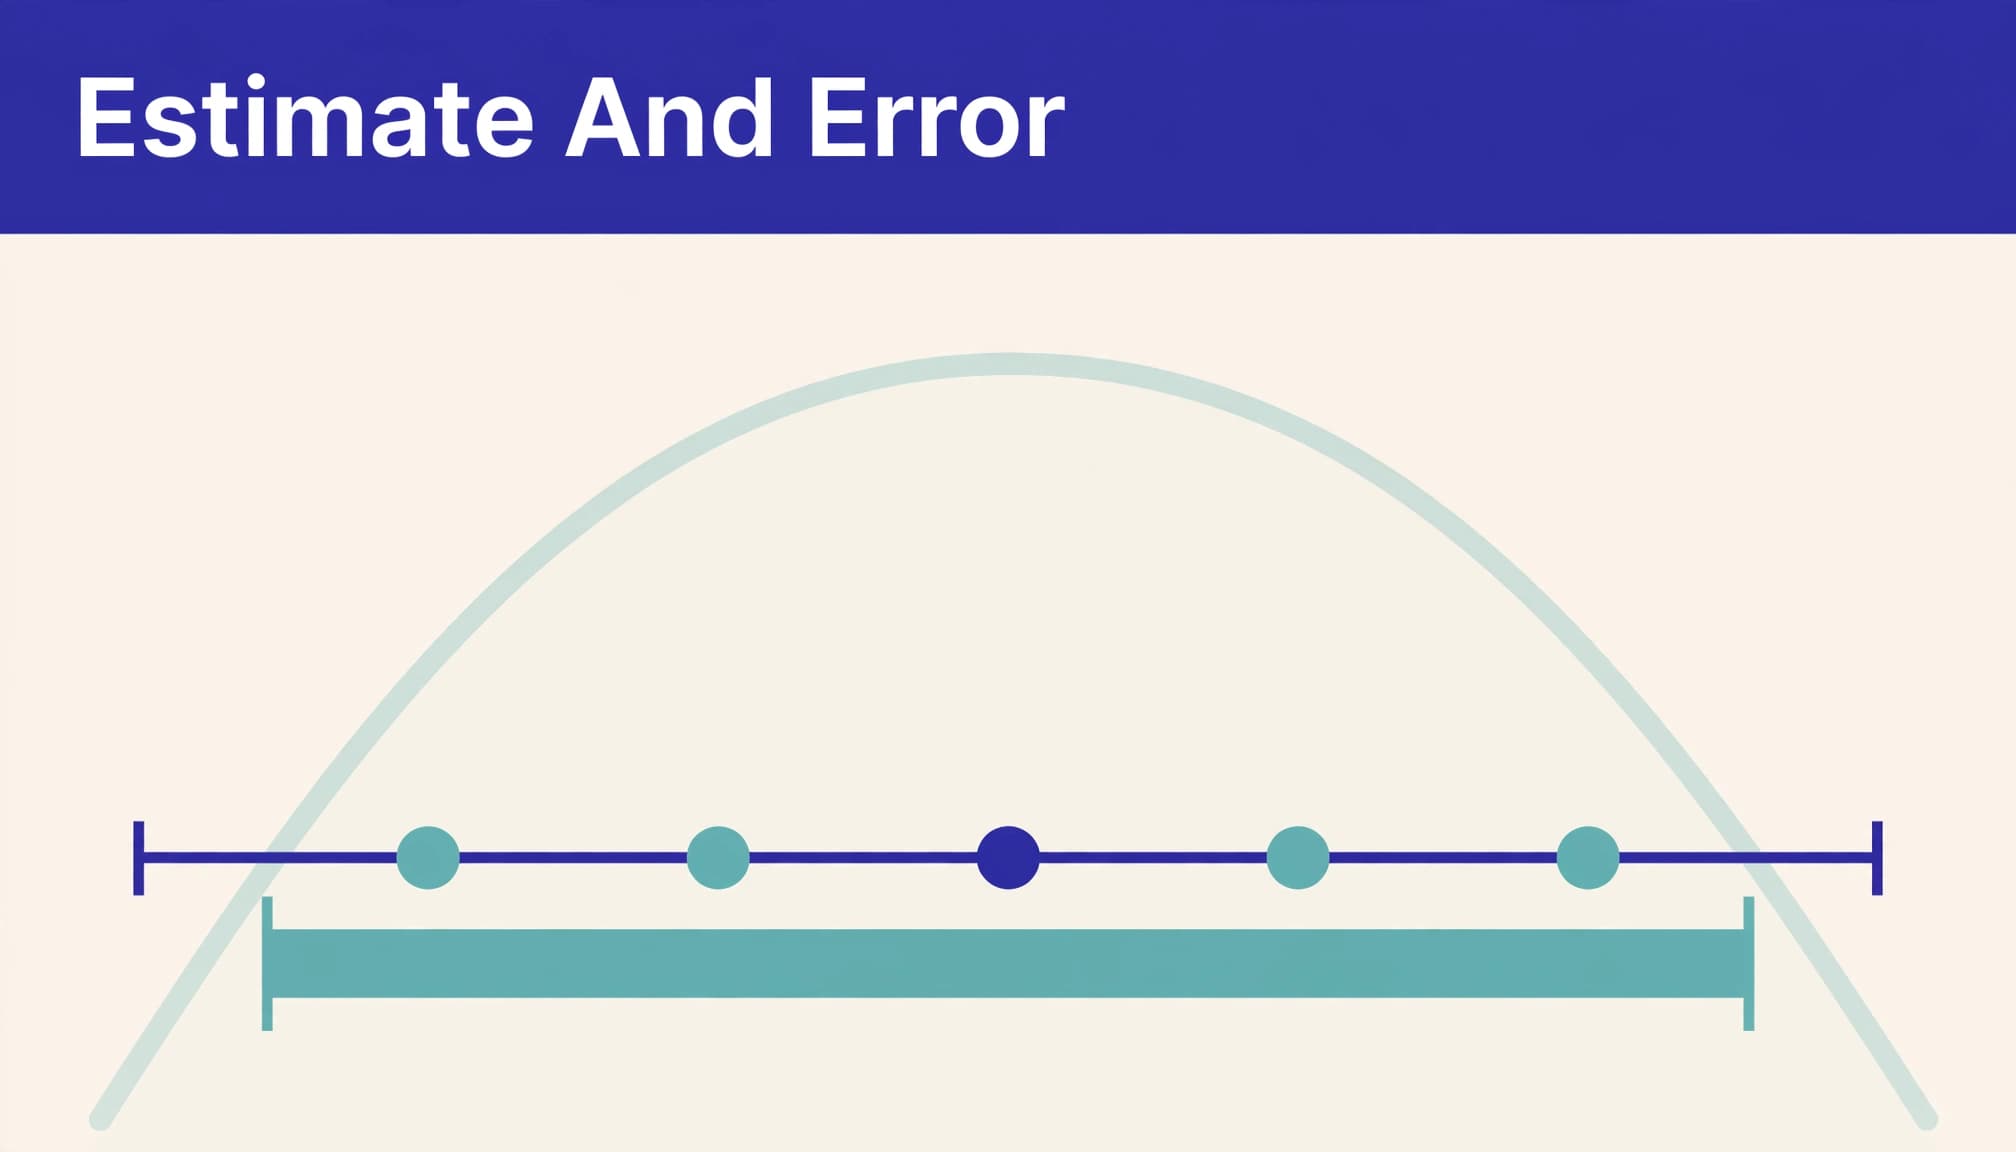
Use the data 10, 14, 16, 28, 20. Because the population standard deviation is unknown, use a t interval.
Find the sample mean. The values total 88. Dividing by five gives x̄ = 17.6.
Calculate the sample standard deviation. Squared deviations from 17.6 are 57.76, 12.96, 2.56, 108.16, and 5.76. Their sum is 187.2. Divide by n − 1: 187.2 / 4 = 46.8. This is the sample variance; its square root gives s ≈ 6.84.
Find the standard error. Divide the standard deviation by √n: SE = 6.84 / √5 ≈ 3.06. Use unrounded values during calculation.
Find the margin of error. With four degrees of freedom, the two-sided 95% t critical value is approximately 2.776. Therefore, the margin is approximately 2.776 × 3.0594 = 8.49.
Apply the results. Calculate 17.6 ± 8.49. The lower bound is approximately 9.11; the upper bound is 26.09.
Interpret the result. The estimated population mean is 17.6, with a 95% confidence interval of 9.11 to 26.09. This wide interval indicates considerable uncertainty about the population mean.
The calculation assumes independent observations from an approximately normal population. Five observations alone can't establish that the population meets this assumption.
Separate statistical significance from practical importance
Compare the interval with the correct null value
In hypothesis testing, group differences use zero as the no-effect value; risk, odds, and hazard ratios use one.
A two-sided 95% interval excluding the null generally corresponds to p < 0.05 when the test and interval use matching methods.
However, an interval containing the null doesn't prove that no effect exists. Its bounds may allow both negligible and important effects.
As the discussion of the ASA statement emphasizes, statistical significance doesn't measure an effect's size or importance.
Compare the bounds with a meaningful effect
Practical importance depends on the outcome and decision. Compare the whole interval with a prespecified clinically, educationally, or economically meaningful effect.
If the interval allows effects too small to matter, a significant finding may offer limited practical value. Conversely, an imprecise result may leave an important benefit unresolved.
Also, one significant study and one non-significant study don't necessarily disagree. Compare their estimates and uncertainty directly. Our guide to comparing conflicting research findings explains why different significance labels can coexist with compatible evidence.
Avoid common interpretation mistakes
Don't infer significance from overlapping error bars
Figure bars may show standard deviations, standard errors, confidence intervals, or another quantity. Read the caption and methods before interpreting them.
If neither identifies the bars, their meaning remains unknown. Overlapping confidence intervals don't automatically establish a non-significant difference; the comparison requires its own analysis.
When using our PDF research assistant, ask: "Locate the effect estimate, interval definition, confidence level, and statistical test. Cite the relevant pages." Compare the answer with the original figure and results paragraph.
Don't confuse precision with validity
A confidence interval primarily describes uncertainty under the statistical method's assumptions. It doesn't automatically include uncertainty caused by missing data, measurement problems, confounding, or selective reporting.
Likewise, a narrow interval around an observational association doesn't establish causation. Study design determines which causal claims the evidence can support.
Increasing sample size can reduce random error while leaving systematic bias largely unchanged.
Finally, values outside the interval aren't impossible, and values inside it aren't automatically equally supported.
Frequently asked questions
Why does 1.96 correspond to 95% confidence?
For a standard normal distribution, approximately 95% of values lie between −1.96 and +1.96. The remaining 5% is split between the two tails.
For an appropriate normally distributed estimator, this produces the familiar estimate ± 1.96 × standard error. A small-sample t interval needs a different multiplier.
Which confidence level is best?
There's no universally best level. Although 95% is conventional, the choice depends on the study's purpose and acceptable uncertainty.
A 99% interval offers higher coverage but is wider. A 90% interval is narrower but has lower coverage. Researchers should choose the level before examining results, rather than selecting whichever produces significance.
How does a proportion interval differ from a mean interval?
A proportion interval estimates a population percentage rather than an average measurement. For independent binary observations, its approximate standard error is √[p̂(1 − p̂) / n].
However, simple normal intervals can perform poorly with small samples or proportions near zero or one. Methods such as the Wilson interval address these problems.
Is a confidence interval the same as a prediction interval?
No. A confidence interval for a mean describes uncertainty about a population average. A prediction interval describes uncertainty about a future observation and is generally wider.
A Bayesian credible interval is different again: it assigns probability to parameter values conditional on the observed data, prior distribution, and model.
Read the range before accepting the conclusion
A confidence interval helps you judge how much uncertainty surrounds a reported estimate. Its meaning depends on the outcome, scale, statistical method, and study design.
Read both bounds before accepting the authors' conclusion. Then separate precision, statistical significance, and practical importance: a convincing interpretation needs all three, not a significance label alone.