Two papers can appear to disagree even when they studied different people, outcomes, or versions of an intervention. That distinction matters when you’re comparing conflicting research findings for a literature review, thesis, policy brief, or evidence-based decision.
AI can reduce the repetitive work of locating methods, results, and limitations across a paper set. It can’t decide what the evidence means, verify an extracted number, or replace your reading of the original sources.
A structured comparison turns conflicting data into a testable explanation and can clarify a research gap instead of producing a vague "mixed evidence" conclusion.
Why conflicting research findings may not truly conflict
A finding only conflicts with another when the studies address sufficiently similar questions and reach incompatible conclusions. Different study conditions often explain the gap.
Compare the research question behind each result
Start by restating each paper's question in one sentence. Then compare the population, exposure or intervention, outcome, setting, time frame, and analysis.
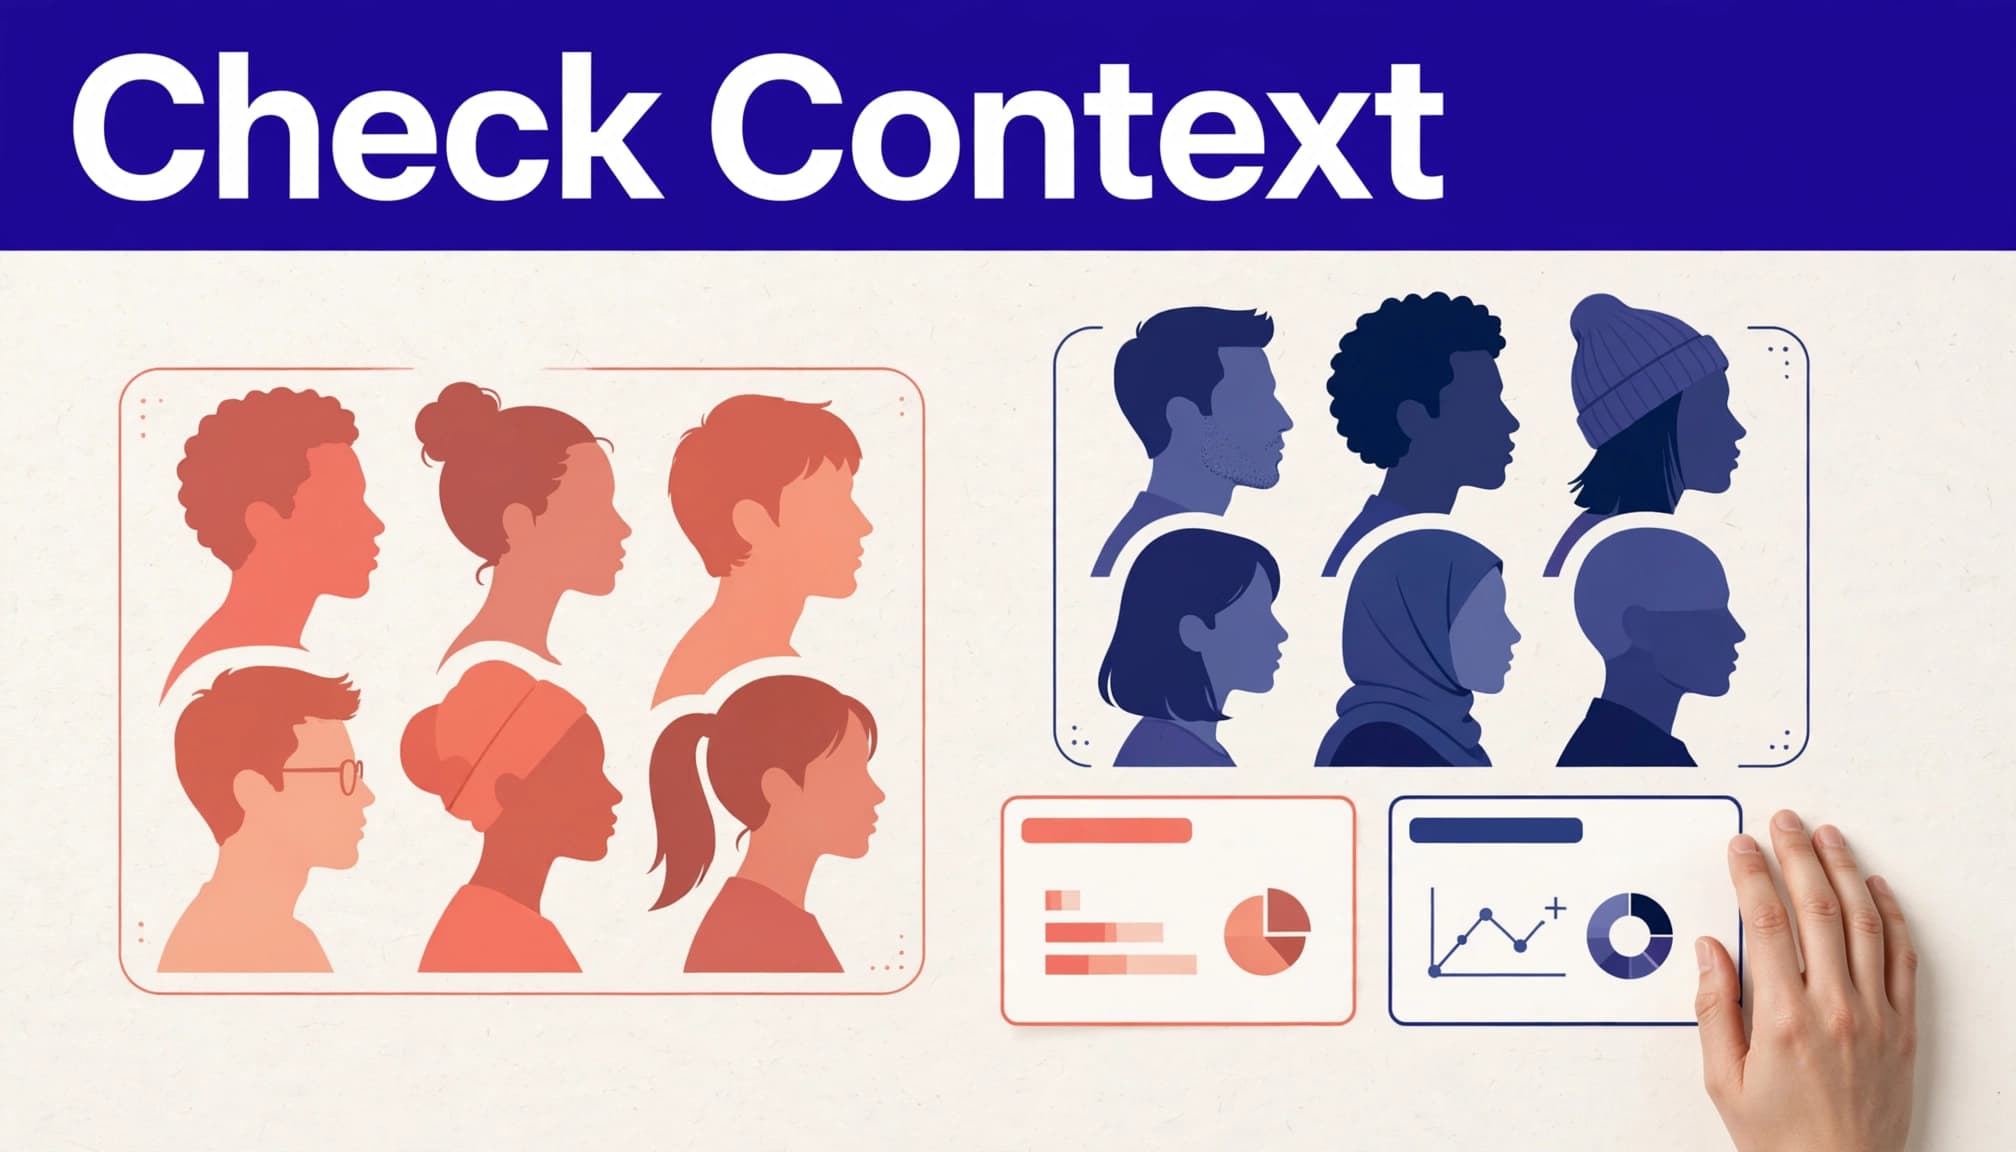
A study of short-term anxiety symptoms in first-year students does not directly contradict a study of long-term clinical outcomes in working adults. Both may be accurate within their own scope. Sampling variation can also contribute to apparently conflicting data across populations.
Small wording changes can alter the construct. "Social media use" might mean daily minutes, active posting, passive browsing, or problematic use. Measurement errors can make studies appear to estimate different relationships.
Separate disagreement from imprecision
A statistically significant result in one paper and a non-significant result in another don't automatically point in opposite directions. Statistical significance depends on sample size and uncertainty, not only the p-value.
Compare the effect estimate and its confidence interval first. If both estimates point in the same direction but one uncertainty range is wide, the evidence may be consistent but imprecise. ARRIVE's guidance on reporting effect sizes and confidence intervals explains why significance tests alone don't communicate the size or uncertainty of an effect.
A non-significant result can be compatible with the estimate from a significant study when their uncertainty ranges overlap substantially.
Build a comparison matrix before asking AI for conclusions
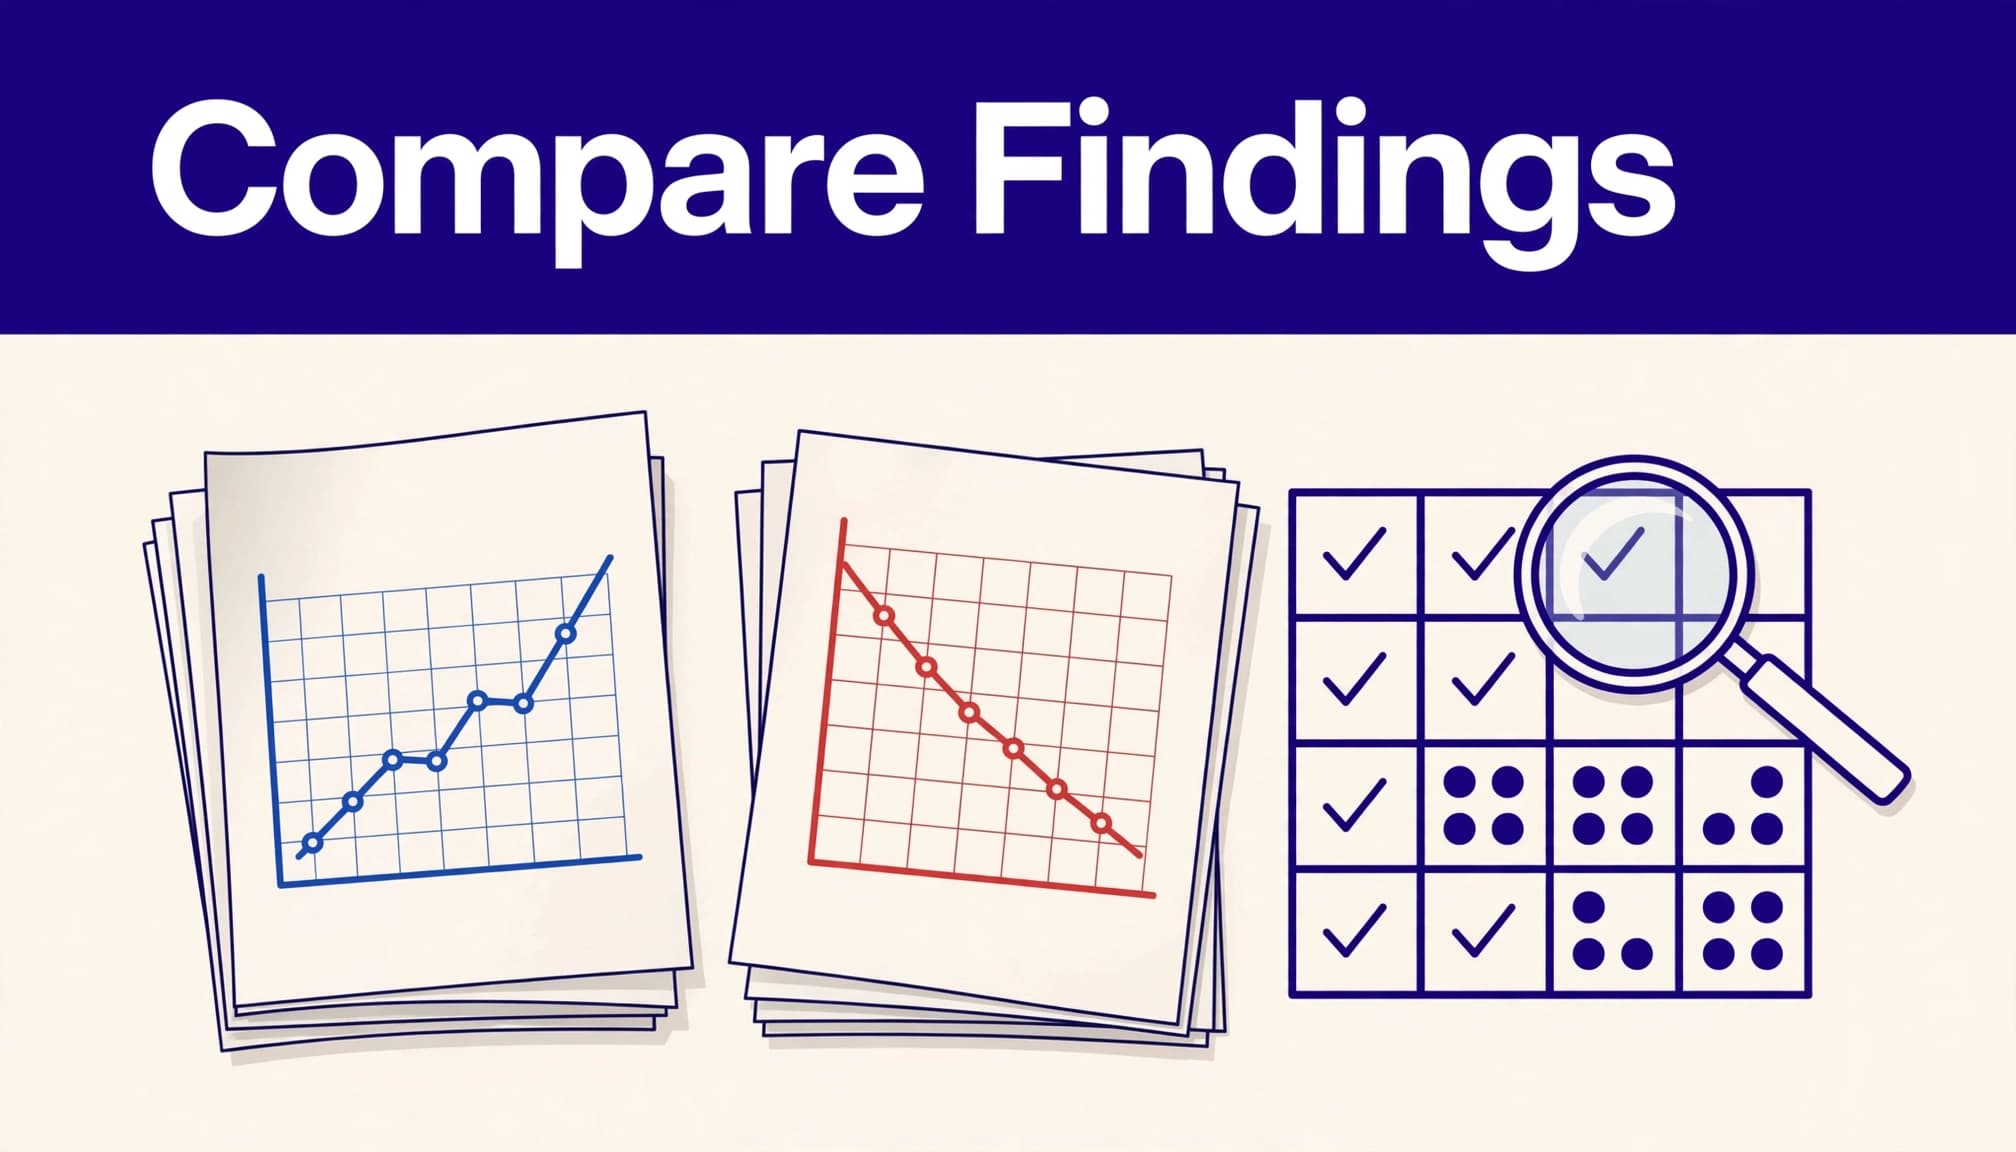
A literature review matrix gives every paper the same fields. It organizes conflicting data, makes meaningful differences visible, and supports later research synthesis.
Field | What to record | Why it matters |
|---|---|---|
Citation and page references | Authors, year, title, relevant pages | Creates a trail back to the source |
Research purpose | The question the authors tested | Checks whether papers address the same claim |
Population and setting | Eligibility, sample size, location, context | Reveals differences in generalizability |
Method and measures | Design, instruments, exposure, outcomes | Identifies construct and design mismatches |
Results | Effect size, confidence interval, adjusted model | Supports a like-for-like comparison |
Limitations | Author-stated limits and review notes | Prevents overconfident synthesis |
The matrix is a working record, not a final evidence synthesis, and a consistently empty field may expose a research gap. Give each source one row, keep entries brief, and add a separate column for "Not reported." Never let an AI tool fill missing facts with plausible guesses.
Extract evidence with source locations
Ask AI for bounded extraction rather than an open-ended verdict. A useful prompt is:
"Using only these uploaded papers, create one row per study. Extract the research question, sample characteristics, setting, design, measures, effect sizes, confidence intervals, main result, and stated limitations. Cite the paper title and page number for every entry. Write 'Not reported' where the paper is silent."
When AI flags conflicting data, trace any data discrepancies to the original paper before interpreting them. Perform data validation yourself by inspecting the abstract, methods, results, tables, discussion, and cited passages. Check statistical significance against the reported results. AI can confuse a background citation with the authors' own result or flatten a qualified conclusion into a stronger claim.
Keep source facts separate from interpretation
Use three note types in your matrix:
Source fact records what the paper reports, with a page reference.
Your analysis records a comparison or interpretation.
AI suggestion flags an idea that still needs verification.
That separation matters when you begin drafting. A statement such as "both studies used validated scales" is a source fact only after you confirm it. A statement such as "measurement differences may explain the results" is your analytical inference.
Use a repeatable AI-assisted comparison workflow
A repeatable process helps investigate conflicting data without forcing agreement. It also gives collaborators a transparent record of how you reached a conclusion.
Run the same checks for every paper
Use this sequence:
Define the exact claim you want to compare, and select papers that address it. Use the same criteria to compare research papers consistently.
Build verified matrix rows from the full texts, not abstracts alone.
Ask AI to flag conflicting data, similarities, and mismatches across the completed rows.
Return to the cited passages and tables for every important difference.
Distinguish numerical differences from meaningful disagreement, including whether statistical significance supports the interpretation.
Classify the evidence as aligned, imprecise, context-dependent, method-dependent, or genuinely contradictory.
Write a cautious synthesis that matches the strength and limits of the evidence, while clarifying any research gap.
AI is useful for sorting long paper sets, locating recurring terminology, grouping methods, and identifying papers that need closer review. Human judgment is essential when deciding whether variables are comparable or whether a limitation changes the interpretation.
Use prompts that limit unsupported claims
Broad prompts such as "Which paper is right?" invite shallow answers. Ask for a narrow comparison with explicit boundaries instead.
Try: "Compare the five verified matrix rows below. Identify differences in population, intervention, outcome definition, follow-up period, covariates, and study design. Cite the source key and page for each observation. Do not infer missing details. Mark possible explanations as hypotheses, not facts."
A second pass can target one issue: "Find every passage discussing participant selection. Quote no more than 25 words per passage, give page numbers, and state whether the authors describe a limit on generalizability."
Check statistical disagreement before calling it a contradiction
Numbers need context. Conflicting data may appear irreconcilable, but an effect estimate rarely settles the question alone. Its scale, uncertainty, and analytical model all matter.
Compare magnitude, direction, and precision
First, put comparable effects on the same scale where possible. Methodological differences can affect how those effects appear. For binary outcomes, check whether papers report risk ratios, odds ratios, or risk differences. For continuous outcomes, check the measure, units, and whether authors used standardized effects.
Next, record the estimate, confidence interval, sample size, and whether the result is adjusted. Conflicting data may reflect differences between crude and adjusted associations. The second model accounts for confounders, so its estimate can change.
Don't treat statistical significance as a complete interpretation. Consider the effect's size, confidence interval, and practical importance alongside the p-value.
Statistical power also matters. Sampling variation can give small studies wider estimates and make an effect harder to detect. Yet a large study can still have systematic bias, so size alone never settles credibility.
Interpret heterogeneity with restraint
In a meta analysis, assess statistical heterogeneity carefully. Cochrane defines I2 as the proportion of variation in effect estimates that reflects heterogeneity rather than sampling error. Its guidance on meta-analysis and heterogeneity describes I2 ranges as rough aids, not fixed verdicts.
For randomized trials, 0% to 40% might not matter, while 75% to 100% can indicate considerable heterogeneity. The ranges overlap because context matters. Review Cochran's Q, tau, prediction intervals, study direction, clinical differences, and risk of bias before deciding whether pooled results are meaningful.
If important differences remain after this review, they may point to a research gap rather than a simple contradiction.
Diagnose why results differ across studies
Once you confirm that papers address a similar core question, look for credible explanations for conflicting data. Differences in research design, implementation, and participant characteristics may explain the results. The most useful answer may be conditional rather than universal.
Examine design choices and risk of bias
Research design affects the claim a paper can support. Randomized trials, cross-sectional surveys, cohort studies, and case-control studies answer different causal questions and face different threats to validity.
Check participant recruitment, sampling variation, attrition, blinding where relevant, missing-data decisions, selective outcome reporting, and model choice. Also inspect preregistration or a published protocol when available. A mismatch between planned and reported outcomes does not prove misconduct, but it can affect confidence in a result and raise questions about research integrity.
Cochrane's network meta-analysis guidance places risk of bias and heterogeneity at the center of evidence interpretation. Apply the same discipline to any cross-paper comparison.
Look for effect modification and context
An intervention can work differently by age, baseline risk, disease severity, culture, organization, geography, or delivery setting. These are contextual factors, not inconvenient details.
For example, an educational intervention delivered by trained staff in a well-resourced clinic may not produce the same outcome in an under-resourced setting. Compare dose, fidelity, access barriers, follow-up length, and concurrent programs before treating the average result as portable. Persistent conflicting data across settings may reveal a research gap that the next study must resolve.
Compare qualitative and quantitative evidence carefully
Qualitative research and quantitative research often make different kinds of claims. Mixed methods can bring them together to address different parts of the same question. Treating them as rival scorecards can obscure what each contributes.
Match the type of evidence to the claim
Quantitative studies can estimate association, difference, or change under stated conditions. Qualitative studies can explain participant experiences, implementation barriers, meanings, and mechanisms.
A survey might find no average change in attendance after a program. Interviews may show that participants valued it but couldn't attend consistently because of transport or shift work. These conflicting data can fit together and point to a problem in delivery rather than a failed intervention.
Use data triangulation to test explanations
Data triangulation compares evidence across methods, datasets, settings, or investigators. Start with a focused question, such as whether effect modification occurs by access to services or how an outcome is measured.
Then ask AI to group only verified matrix entries by theme and method. Review the underlying passages before accepting any pattern. If inconsistent findings appear across methods, treat the theme as tentative, especially when it rests on only one or two papers.
When conventional pooling doesn't fit the evidence, Cochrane's guidance on other synthesis methods supports transparent alternatives to a single meta-analytic estimate. A persistent unexplained pattern may then define a research gap.
Turn unresolved evidence into a defensible research gap
Conflicting data can justify a research gap when disagreement leaves an important question unresolved. “Studies are mixed” is a starting point, not a complete gap statement.
Define the missing explanation
A stronger research gap identifies what existing studies cannot yet establish. The uncertainty may reflect incompatible outcome measures, excluded high-risk populations, or short follow-up periods. Differences in research methodology can also make results difficult to compare.
Check a recent systematic review before making that claim. Your matrix may reveal a possible research gap in your collection, but an incomplete search can create a false gap. Conflicting data may result from incompatible measures or populations rather than a true contradiction.
Design the next study around the source of uncertainty
Your follow-up design should test the suspected explanation behind the research gap. If measurement differences drive disagreement, use a validated, clearly defined outcome. If context appears important, test for effect modification across settings and prespecify the subgroup analysis when appropriate.
Document the sampling plan, analysis strategy, and primary outcomes before data collection when appropriate. Report limitations honestly, even if the findings favor your expectation.
Key takeaways for an AI-supported evidence review
Compare full-text evidence before labeling conflicting data as contradictory. Population, measure, time frame, design, and analysis often explain the difference.
Ask AI to extract structured, page-linked evidence and surface mismatches. Verify every material claim against the original paper.
Treat effect sizes, confidence intervals, power, heterogeneity, and risk of bias as a set. Statistical significance alone cannot establish disagreement.
Use unresolved findings to define a clearer research gap and guide the next stage of investigation.
Frame a research gap around an unresolved explanation, then confirm it through a broader literature search and a current systematic review.
Frequently asked questions
Can conflicting findings count as a research gap?
Yes, when the disagreement blocks a reliable conclusion about an important question. A defensible research gap identifies the source of uncertainty, such as a missing population, incompatible outcomes, or unclear contextual conditions.
Before stating that gap, expand the search and consult a recent systematic review. A matrix only reflects the papers it contains.
Where does AI help most when comparing research papers?
AI is effective at extracting repeated fields, locating relevant passages, grouping verified notes, and flagging differences across a large document set. It can also produce a first-pass comparison table with source locations.
Researchers must still read the cited passages, verify numerical values, assess study quality, and decide whether the papers answer comparable questions. AI output organizes conflicting data into a lead, not verified evidence.
What should I do when a paper does not report a needed detail?
Record "Not reported" in the matrix. Don’t infer a sample characteristic, measure property, statistical adjustment, or limitation from nearby wording.
That gap may affect how much weight you give the study. It can also identify a reporting problem that limits cross-study comparison.
A careful synthesis is stronger than forced agreement
Conflicting research findings become useful when you trace them to their sources instead of averaging conflicting data into a simple answer. A verified matrix, focused AI prompts, and full-text review make that work more manageable.
The strongest evidence synthesis distinguishes where evidence aligns, where inconsistent findings persist, and which conditions may change the result. Human judgment connects these comparisons to empirical evidence, identifies a research gap, and supports conclusions readers can trust.