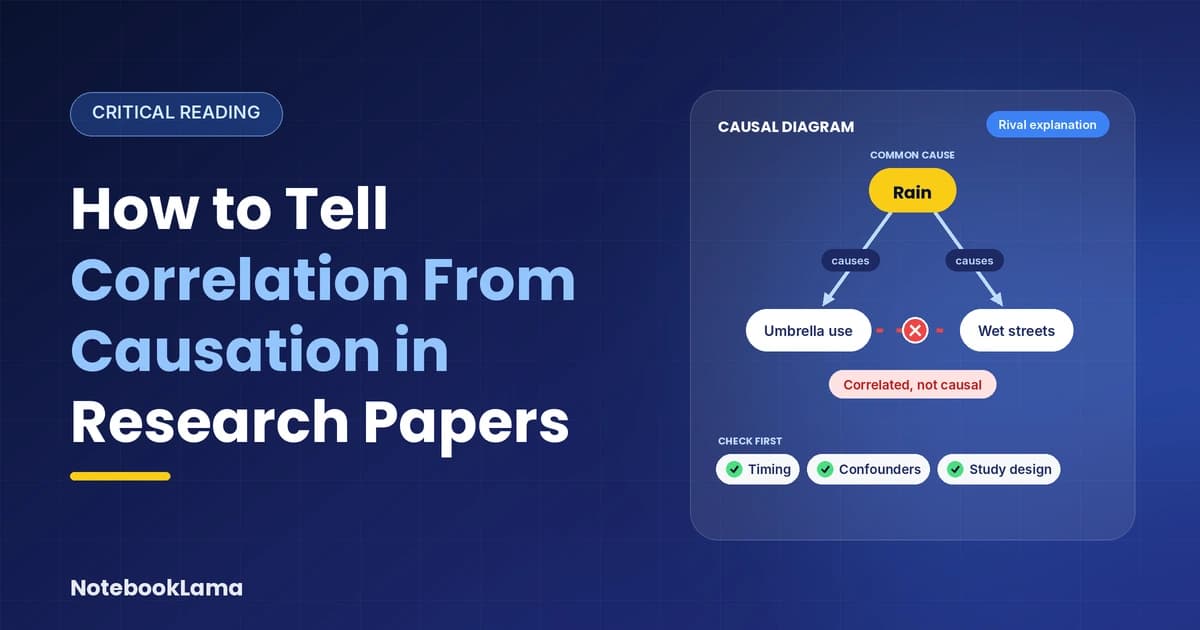
Correlation does not imply causation. Even when two variables have a strong relationship, that relationship alone cannot show that changing one variable would change the other. To assess a causal claim, examine how researchers created their comparison, established the timing of events, and ruled out competing explanations.
When evaluating correlation vs. causation, study design matters more than a confident abstract or a small p-value. Start with what the researchers measured, then examine what their methods allow them to conclude.
Key takeaways
Correlation describes a relationship between variables; causation means that changing one variable produces a change in another.
Confounding, reverse causation, selection bias, and chance can create misleading relationships.
Randomized trials can provide stronger causal evidence, while observational studies can support causal conclusions when their assumptions are carefully examined.
Bradford Hill’s viewpoints help researchers assess whether an observed association may be causal, but they are not a checklist that proves causation.
Causal diagrams help make assumptions about relationships between variables visible.
Statistical significance and a strong correlation do not independently establish cause and effect.
Correlation vs. causation: what the claim means
The distinction becomes clearer when you separate three terms researchers sometimes use loosely.
Association and correlation describe patterns
An association exists when knowing something about one variable provides information about another. Correlation usually describes the direction and strength of a numerical relationship.
For example, Pearson’s correlation coefficient, written as r, measures the direction and strength of a linear relationship between two numerical variables. Its values range from −1 to +1. A positive value indicates that higher values tend to occur together, while a negative value indicates that higher values of one variable tend to accompany lower values of the other.
However, Pearson’s correlation measures linear relationships. Two variables can have a curved relationship that a linear coefficient captures poorly. A correlation close to zero therefore does not rule out every possible relationship.
For a more detailed explanation, see the National Institute of Standards and Technology’s guidance on correlation.
Causation concerns what would happen after a change
A causal claim says that intervening on one variable would change an outcome, compared with what would happen without that intervention. The independent variable is what researchers change or compare, while the dependent variable is the outcome they measure.
In medical research, this means comparing outcomes under a treatment with outcomes under a suitable alternative. Because the same person cannot experience both conditions at the same time, researchers need a credible comparison group.
The central question is whether the comparison separates the treatment’s effect from differences that would have existed anyway. A convincing explanation alone cannot establish causation. Researchers must also show why competing explanations are unlikely.
Why two variables can move together
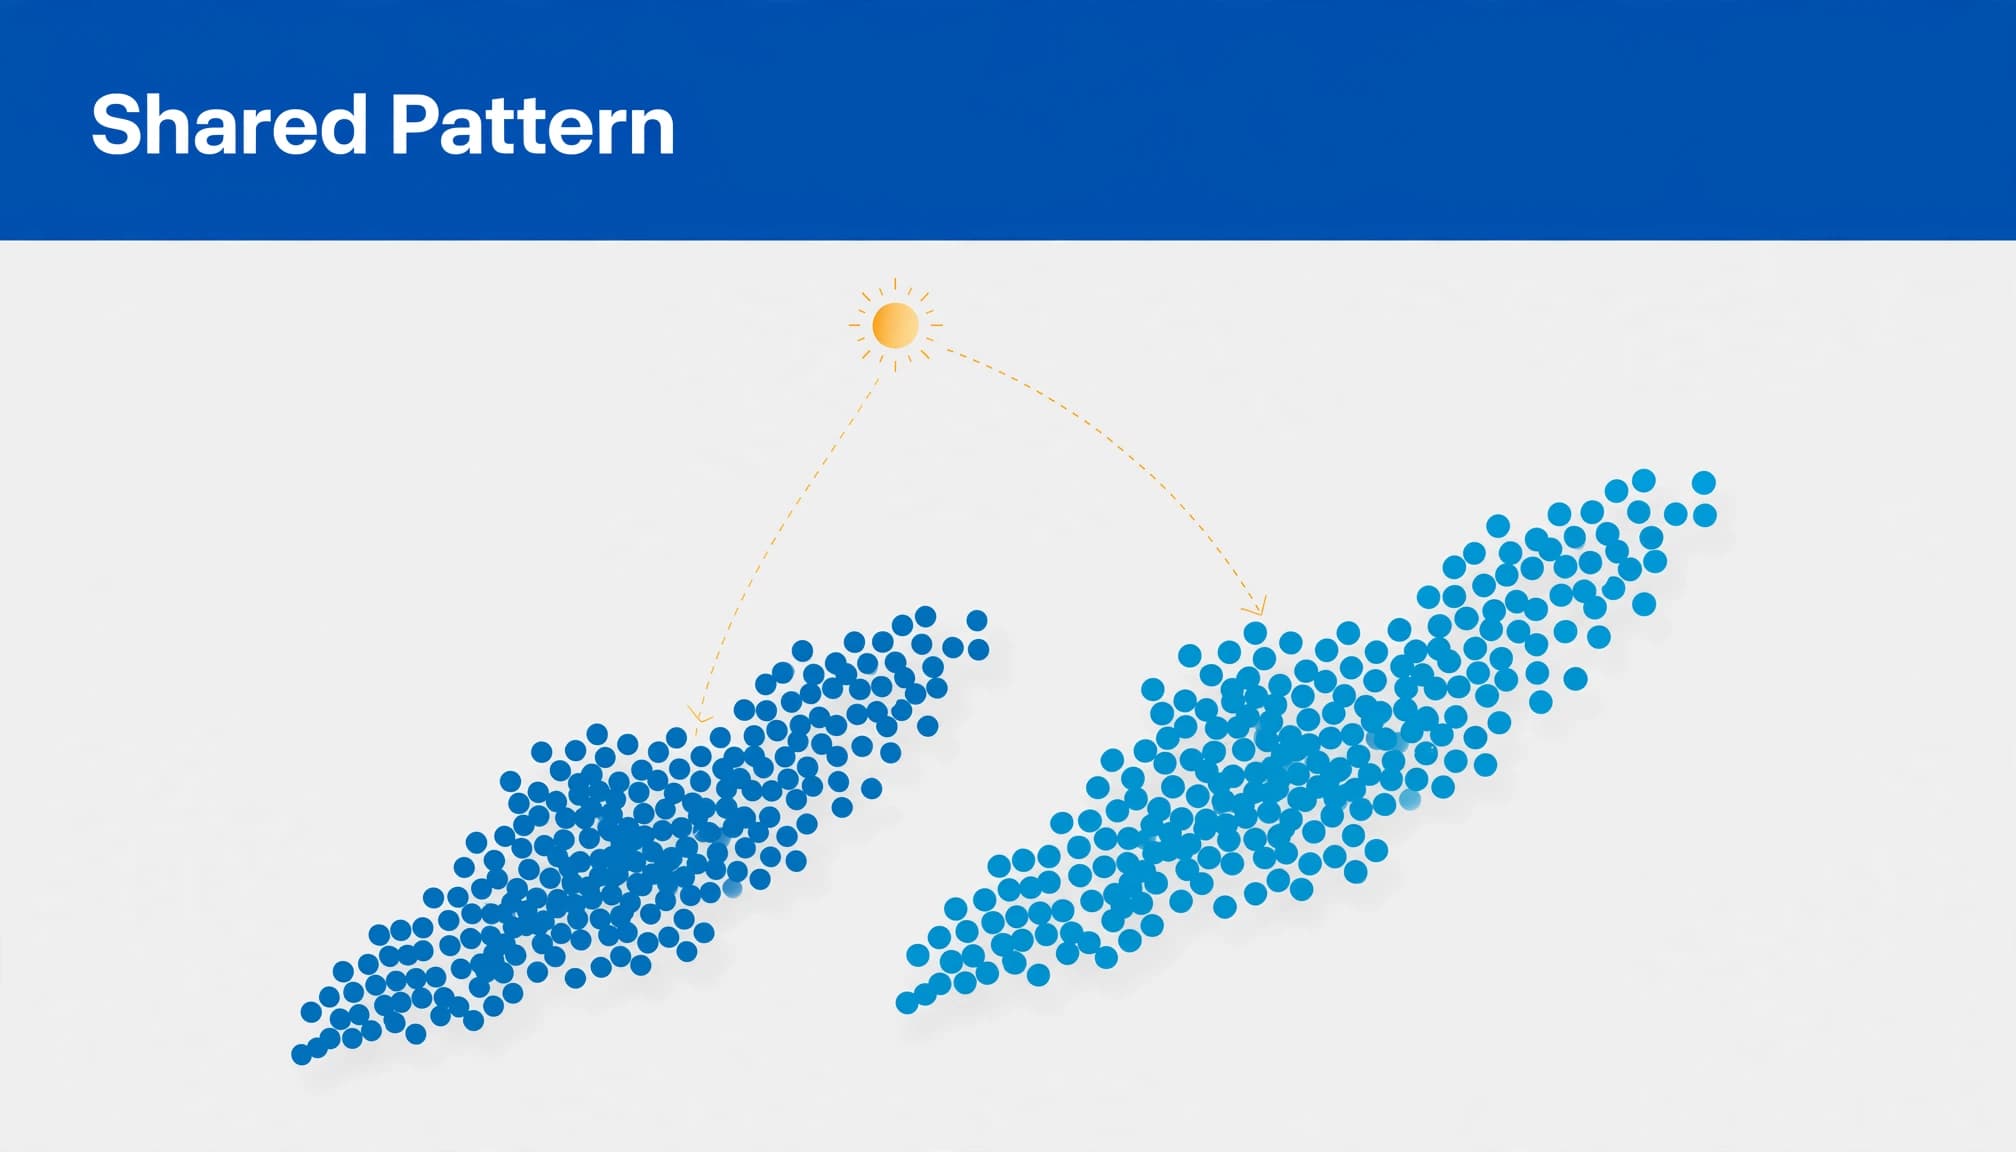
A relationship between two variables can arise for several reasons. The proposed cause may influence the outcome, but another variable may influence both. The direction of the relationship may also be reversed, or the pattern may result from how participants were selected.
A third variable can cause both
Rain increases umbrella use and makes streets wet. Umbrellas and wet streets occur together, but carrying an umbrella does not make the pavement wet. Rain is the common cause of both observations.
In research, a confounding variable can create or distort an association between an exposure and an outcome. For example, age can affect both medication use and disease risk. An analysis that ignores age may attribute differences to medication that partly reflect differences in participants’ ages.
A published example comes from research into menopausal hormone therapy and cardiovascular disease. An observational analysis of 70,533 postmenopausal women in the Nurses’ Health Study reported a lower rate of major coronary events among current hormone-therapy users than among women who had never used the therapy. The adjusted relative risk was 0.61.
That result described an association, not proof that hormone therapy prevented coronary disease. The women who chose to use hormone therapy could differ from non-users in ways that affected their health outcomes.
Read the observational study in Annals of Internal Medicine.
Direction, selection, and chance can mislead
Reverse causation means that the proposed outcome influences the proposed cause. For example, pain can prompt a person to take painkillers. An association between painkiller use and pain does not establish that the medication caused the pain.
Selection bias occurs when the way participants enter, remain in, or are excluded from a study creates a distorted comparison. People who volunteer for research, receive a particular treatment, or complete a long-term study may differ from those who do not.
Chance findings can also appear when researchers test many relationships. Repeated measurements and independent replication help assess whether a pattern is consistent, but repeating the same biased design can reproduce the same misleading association.
How stronger study designs support causation
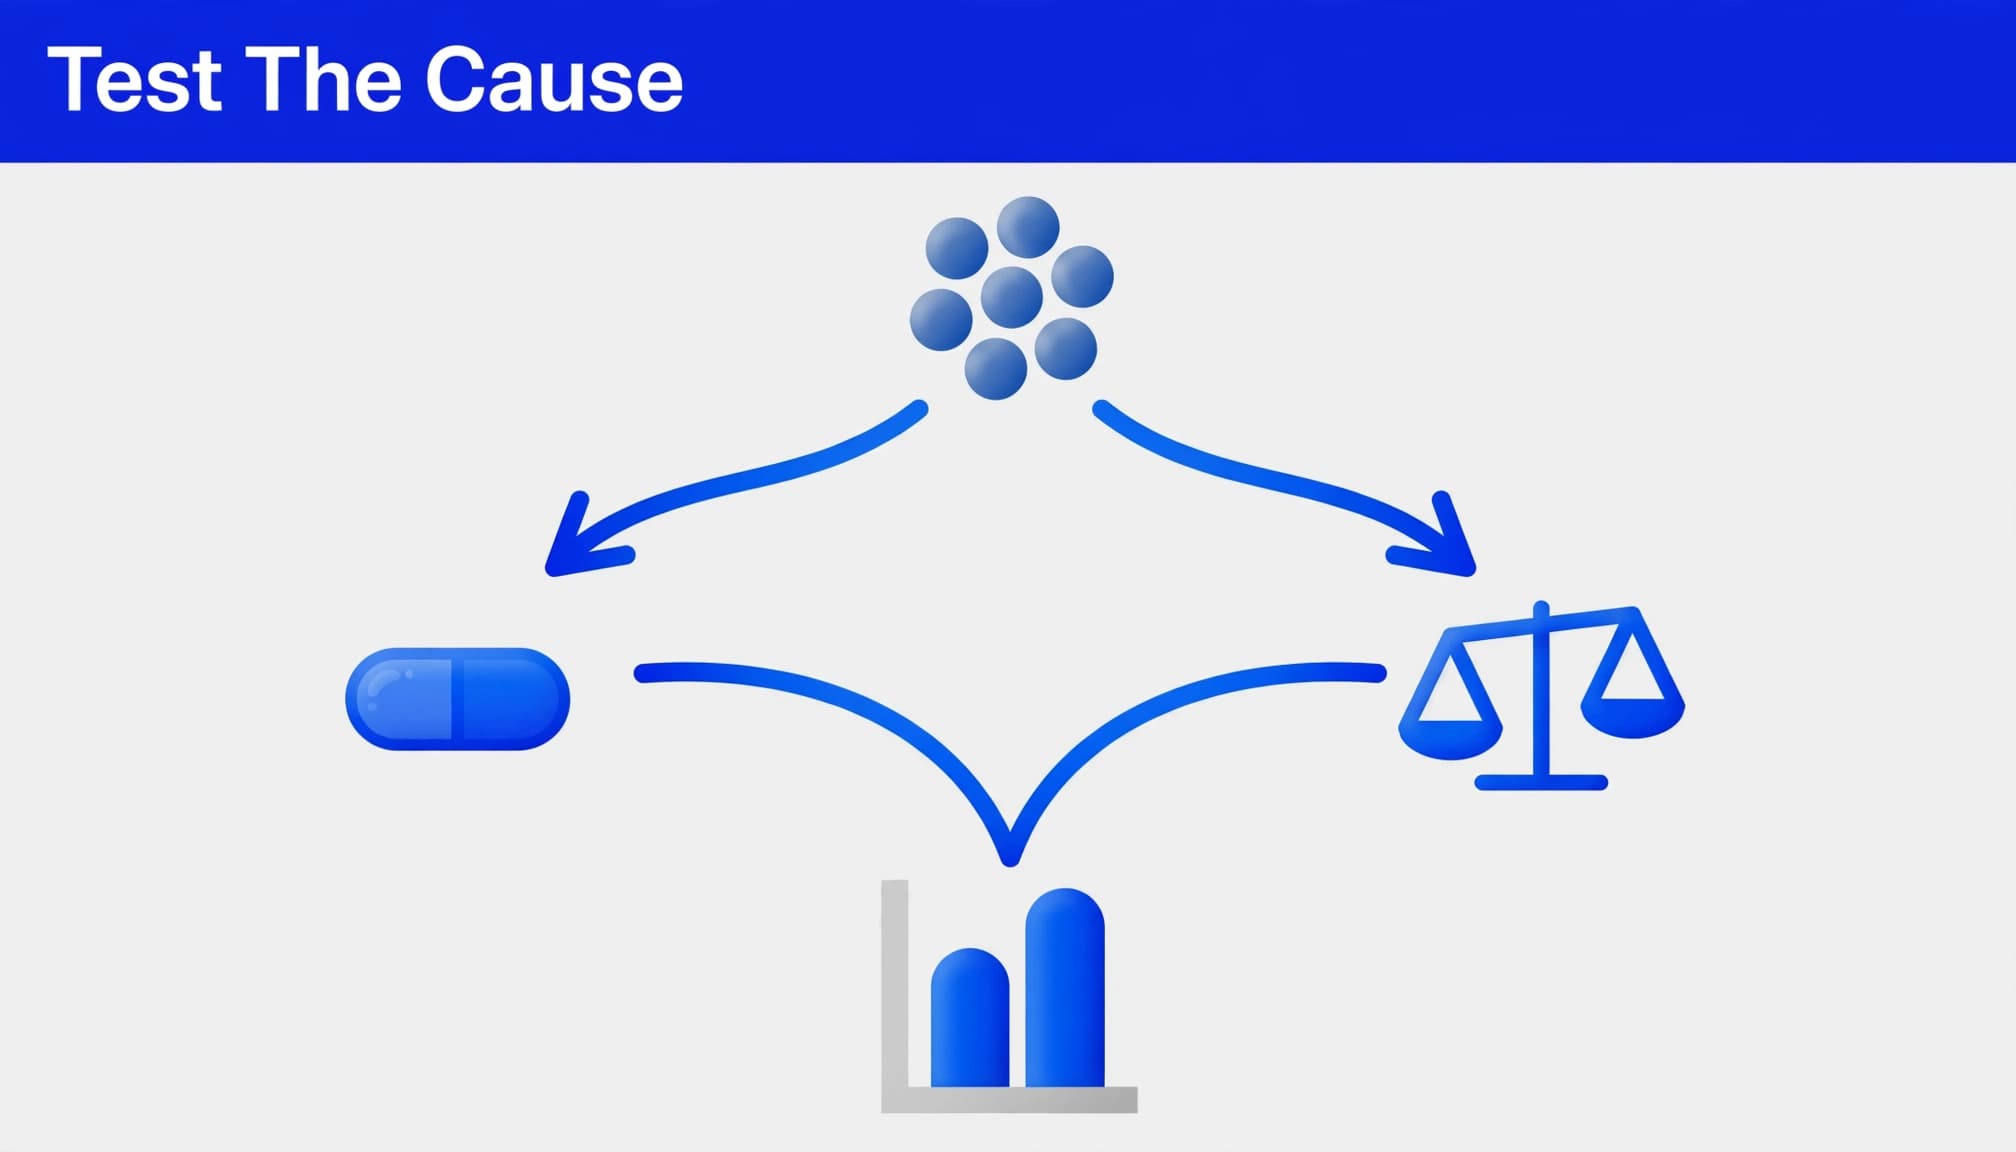
Randomized trials create a stronger comparison
A randomized controlled trial assigns participants to groups by chance. Randomization helps balance measured and unmeasured baseline characteristics between groups on average, reducing confounding.
A/B testing is a familiar example of a controlled experiment when users are randomly assigned to different versions. The outcome measures, assignment process, and implementation still need scrutiny.
The Women’s Health Initiative (WHI) provides an important example of why study design matters. In 2002, its randomized trial included 16,608 postmenopausal women aged 50 to 79 with an intact uterus. Participants received either combined estrogen plus progestin or a placebo. After a mean follow-up of 5.2 years, the trial reported an increased risk of coronary heart disease in the hormone-therapy group, with a hazard ratio of 1.29.
This result challenged the protective association suggested by earlier observational research. The difference illustrates why an observed relationship should not automatically be interpreted as a treatment effect.
Read the original 2002 WHI trial report in JAMA.
Randomization does not make every conclusion automatically reliable. Check how researchers handled missing outcomes, participant adherence, allocation procedures, and outcome assessment. Also examine whether the results apply to the population and treatment being discussed.
Observational studies need defensible assumptions
A cross-sectional study measures variables around the same time, so it often cannot establish which came first. A longitudinal study follows participants over time and can establish temporal order more clearly.
However, following people for longer does not automatically remove confounding. Researchers may use adjustment, matching, or weighting to improve comparisons, but unmeasured differences can remain.
Natural experiments offer another route. Policy changes or assignment thresholds can create useful comparisons without researcher-controlled randomization. Their credibility depends on assumptions, such as whether the groups would otherwise have followed similar trends.
Observational data can support causal conclusions when the research design and analysis address alternative explanations. The assumptions must be defensible, and the limitations must be reported. Calling an analysis “causal” is not enough.
Bradford Hill’s viewpoints: assessing a possible causal relationship
In 1965, epidemiologist Austin Bradford Hill described several viewpoints that researchers could consider when deciding whether an observed association might be causal. These are often called the Bradford Hill criteria.
They include:
Strength: Is the observed association large, or could it plausibly be explained by bias or confounding?
Consistency: Have different studies, populations, or methods found similar results?
Specificity: Is the association limited to a particular exposure and outcome? This viewpoint is less useful when one cause can produce several outcomes.
Temporality: Did the proposed cause occur before the outcome? This is essential to a causal explanation.
Biological gradient: Does a change in exposure correspond to a change in the outcome, such as a dose-response pattern?
Plausibility: Is there a scientifically credible mechanism that could explain the relationship?
Coherence: Does the proposed explanation fit with what is already known about the condition and related evidence?
Experiment: Does changing or removing the exposure alter the outcome in a way that supports the proposed relationship?
Analogy: Are there comparable relationships that make the proposed explanation more credible?
These viewpoints help organize evidence; they are not nine mandatory boxes that must all be checked. A causal relationship may be credible even when some viewpoints are absent or difficult to assess. Temporality, however, is indispensable: a cause must precede its effect.
Hill’s original discussion is available in The Environment and Disease: Association or Causation?.
Causal diagrams: making assumptions visible
A causal diagram, often called a directed acyclic graph (DAG), represents proposed relationships between variables using nodes and arrows. It helps researchers identify possible confounders, mediators, and other variables that may affect an analysis.
Consider a simplified example:
             C: Common cause
              /           \
             v             v
      X: Exposure ------> Y: Outcome
In this diagram:
X is the exposure researchers want to study.
Y is the outcome they want to explain.
C is a common cause that may influence both X and Y.
The arrow from X to Y represents the causal relationship being investigated.
If C affects both the exposure and the outcome, an observed relationship between X and Y may partly reflect C. Researchers must consider whether C should be measured and adjusted for.
A more complex diagram might include a mediator:
X: Exposure ------> M: Mediator ------> Y: Outcome
       \                              ^
        \-----------------------------|
Here, M represents a variable through which some of X’s effect on Y may operate. Adjusting for a mediator can remove part of the effect researchers intend to estimate. That is why adding every available variable to a statistical model is not necessarily a good strategy.
DAGs make assumptions easier to discuss, but they do not prove that the arrows are correct. The diagram reflects the researcher’s proposed causal structure and should be supported by subject knowledge and evidence.
For a practical introduction to causal diagrams and confounder selection, see this methodological tutorial on confounding and sensitivity analysis.
Read the statistics without upgrading the claim
Correlation strength and significance answer different questions
Pearson’s correlation coefficient describes the direction and strength of a linear pattern. It does not measure how likely causation is, and universal labels such as “strong” can hide differences between research fields.
In hypothesis testing, a p-value measures how incompatible the observed data are with a specified statistical model, often one that assumes no association. It does not give the probability that a causal claim is true.
The American Statistical Association warns against treating a p-value threshold as a verdict. Statistical significance does not establish the size or importance of an effect, and conclusions should account for study design, measurement quality, and the assumptions behind the analysis.
Read the American Statistical Association’s statement on statistical significance and p-values.
Adjustment and precision do not eliminate bias
When reviewing a study, record the effect estimate, uncertainty interval, sample size, and adjustment variables. Also distinguish risk ratios, odds ratios, and risk differences; they are not interchangeable.
An adjusted association can differ substantially from an unadjusted one. However, adjustment works only under suitable assumptions. Controlling for a variable caused by the exposure can block part of the effect researchers want to estimate.
A large sample can produce a narrow confidence interval around a biased estimate. Precision describes statistical uncertainty under the analysis; it does not protect against every methodological error.
A practical checklist for reviewing a paper
Read the methods and results before accepting the discussion’s causal language. Apply these questions to the exact exposure, outcome, population, and follow-up period.
Did the proposed cause come first? Locate the measurement dates. Assuming that one event caused another simply because it happened first is a form of the post hoc fallacy. Temporal order is necessary, but it does not establish causation. Simultaneous measurements usually cannot establish direction, and retrospective reports may introduce recall errors.
What could cause both variables? Identify plausible confounders, then inspect the authors’ adjustment strategy. Consider important factors they could not measure rather than counting how many controls they included.
Is there a plausible causal pathway? Look for an explanation connecting the exposure to the outcome. Biological or behavioral plausibility supports an argument, but a convincing story is not experimental evidence.
How did the comparison groups arise? Distinguish random assignment from voluntary participation, clinical decisions, or policy eligibility. Ask what makes the groups comparable before the exposure occurred.
Could study procedures distort the result? Inspect recruitment, exclusions, attrition, missing-data decisions, and outcome measurement. Where available, compare reported outcomes with the preregistration or published protocol.
Do the statistics match the claim? Examine effect size, uncertainty, multiple testing, and sensitivity analyses. Watch for confirmation bias: the tendency to favor information that supports an existing belief while overlooking evidence that challenges it. For example, researchers may emphasize favorable outcomes after testing many possible relationships. A small p-value does not establish practical importance or resolve confounding.
Does the conclusion stay within the evidence? Check whether causal wording applies to the studied population, treatment, outcome, and duration. Do not generalize a short-term result into a lifelong effect.
Figures need the same scrutiny. Read captions, exclusions, and preprocessing details; a smooth curve may be a fitted model rather than observed measurements. A causal diagram can clarify the assumptions behind a model, but its arrows are not proof that the proposed relationships exist.
Match your wording to the evidence
When the comparison does not support causation, use language such as “was associated with,” “co-occurred with,” or “predicted.” In statistical writing, “predicted” can describe a model’s performance without implying cause and effect.
Reserve stronger wording, including “reduced,” “increased,” or “caused,” for evidence that supports the relevant causal claim. Even then, retain the population, intervention, outcome, and time frame that define the finding.
Use AI Document Chat to inspect a research paper
When reviewing a long paper, AI Document Chat can help locate study details and author-stated limitations. Upload the paper and use a source-bound prompt:
Identify the study design, exposure, outcome, comparison group, adjustment variables, main effect estimates, and author-stated limitations. Give page references for every finding. Do not infer missing details; write “Not reported” when the paper does not provide the information.
Illustrative example of the kind of structured output to look for:
Field | Example extracted finding |
|---|---|
Study design | Randomized controlled trial |
Population | 16,608 postmenopausal women aged 50–79 with an intact uterus |
Exposure | Combined estrogen plus progestin |
Comparison | Placebo |
Main outcome discussed | Coronary heart disease |
Reported estimate | Hazard ratio 1.29; 95% confidence interval 1.02–1.63 |
Important limitation | The result concerns the specific treatment regimen and population studied; it should not automatically be generalized to every hormone formulation or population |
Source location | WHI principal report, JAMA, 2002, pages 321–333 |
This is an illustrative extraction based on the published WHI report, not a claim that the tool generated this exact response. Always open the cited pages and verify that the evidence supports the sentence you intend to write. A correct page reference helps you find the evidence; it does not replace your own review.
Frequently asked questions
Can causation exist without correlation?
Yes. Pearson’s correlation measures linear relationships, so a curved causal relationship can produce little or no linear correlation. Effects can also cancel across groups or be obscured by measurement error. An r near zero does not rule out every causal relationship.
Can observational studies ever show causation?
Yes. Observational studies can provide evidence for causal conclusions when researchers establish temporal order, address plausible confounders, use a defensible comparison, and explain the assumptions behind their analysis. Methods such as natural experiments, regression discontinuity, and instrumental-variable analysis can strengthen causal inference in appropriate settings. However, unmeasured confounding and other biases may remain, so conclusions should reflect the design’s limitations.
Why do psychologists warn against causal claims from correlations?
Many psychological variables influence one another and share common causes. Sleep, mood, and stress can interact, while self-reports introduce additional measurement problems. A correlational study can identify relationships, but causal interpretation requires stronger design features or explicit assumptions that address competing explanations.
Let the comparison determine the conclusion
The strongest way to assess correlation vs. causation is to examine why the comparison groups differ. Timing, statistical adjustment, Bradford Hill’s viewpoints, and causal diagrams can all help researchers evaluate an explanation. None should be treated as a substitute for a credible study design.
Before repeating a paper’s headline, work through its methods, assumptions, and limitations. Keep your wording tied to the evidence the comparison supports, including the population and time frame studied.